The Future of Windows Server Management

Say hello to what will very likely be the Server Manager replacement in Windows Server 2019: Windows Admin Center (WAC). Formerly Project Honolulu, WAC has officially gone GA with build 1804. Microsoft clearly has big plans for this tool which has the potential to replace everything and anything currently based on the well aged Microsoft Management Console (MMC). It will probably be the release that follows Server 2019 before we see any possible real deprecation of MMC.

Installation

Because WAC is a web service that manages individual servers, it must be installed on every node you intend to manage, for Server 2016/ 2012R2. Installation is a pain-free affair requiring only permission to modify a particular server’s trusted hosts settings, a designated web port for management and either a 60-day self-signed or other generated SSL cert.

If managing a cluster or larger environment, whichever node you intend to use as a gateway for management access must have visibility to all other nodes in the cluster or environment. Here I’m using S2D1 as my gateway and have manually added all relevant hosts and cluster objects. You can optionally use any Server 2016 or Win10 PC as a gateway to provide management access to all other servers in your environment. From what I can tell, the only thing that truly designates a node as a “gateway” is by adding other objects to it, per below.

The designated gateway itself can then authenticate assigned users or administrators based on local or Azure AD.

Upon installation, WAC will enable a few additional solutions depending on the features installed on your server. For my scenario WAC provided 4 distinct management panes: Server Manager, Computer Mgmt, Failover Cluster Manager and a brand new Hyper-Converged Cluster Manager.

Additional modules and configuration pages will be installable as extensions within WAC. All of the configuration pages in the sections that follow are essentially extensions so the extensibility of this tool is really only limited by the extensions available. Read: this tool has been designed for big things!

Computer Management

A notable change possibly coming here is that Computer Management will be for Win10 PCs only at some point. Right now you can use Server or Computer Management on servers, as neither tool is capable of completely replacing the other. “Computer” in this context will soon mean “PC”.

Server Manager

This is where the majority of new functionality exists currently. To a large extent, this is a combination of the legacy Server Manager tool with a few of the MMC-based tools and a nice coat of webby modern polish. Not all functionality is present here and for many things you will still need to access the MMC tool counterpart. A lot the items available are self explanatory but I’ll showcase a few of the interesting additions below.

Real-time system performance charts are visible on the Overview page with an option to enable disk metrics separately. The warning that follows suggests that these metrics consume a great deal of overhead so to only use when you must and then disable when you are finished. Notice that only my C drive is visible here, no Cluster Shared Volumes in use by S2D running on this same host. This appears to be a Server 2019 feature only.

Some areas are surprisingly good with new concise takes on existing models, such as the Firewall configuration. I can very simply see all incoming/ outgoing rules and easily create a new rule without having to use a series of wizard-driven questionnaires or multi-tab MMC dialogs. This is a fantastic example of what this tool should endeavor to change in future versions of Windows. If more granular manipulation is required, the settings dialog of any rule can be accessed to change things further.

A largely-functional network management stack is a welcomed addition here, no longer requiring ncpa.cpl to alter IP or DNS settings.

Another nice addition here is a fully functional and integrated Shell window. I can do whatever I need to within PowerShell right from WAC.

The registry editor makes an appearance here, no longer requiring regedit.exe to make any needed changes.

The Remote Desktop page provides an embedded frame for direct RDP connection to the server you are connected to. No need to launch a separate RDP client.

The Updates page in WAC appears to be a bit better than the Windows Update tool in the newer Settings UI. Windows Update says I only need a SQL SP2 update:

WAC shows me this same SQL update but a slew of others too, including Intel hardware driver updates. Awesome!

Hyper-V can be managed from WAC as well providing useful event and resource usage data including the ability to manipulate the VMs directly. One thing I don’t like about the current toolset is that when attempting to connect to a VM I am greeted with a popup to save a .rdp file, no direct/ protocol-less console. Hopefully this will get better.

Virtual Machine Inventory shows a summary view of all VMs on this particular host along with real-time resource utilization and clustered status. Important to note that VMs running as clustered on other nodes are not shown here.

The new VM dialog is simple and consolidated enabling quick deployment via minimal hoop jumping.

The full VM settings dialog is also available here for granular settings changes. This may actually be good enough to almost completely deprecate Hyper-V Manager for day-to-day use. Awesome!

Hyper-Converged Cluster Manager

To fully manage S2D clusters with Admin Center you need to be running a preview build of Server 2019, which I don’t have yet. Even though the error dialog below says an April patch is required for Server 2016, per this article, that’s not accurate. This gives a sense of the things the UI will let you do here however. It’s unclear if Admin Center will facilitate S2D setup or not, or if PowerShell will still be required for this in Server 2019.

Failover Cluster Manager

While Hyper-Converged Cluster Manager does not work for Server 2016, Failover Cluster Manager does, to some extent. If you have a S2D cluster some of this will not work, namely the details section on the Disks page. Anything touching S2D directly will likely fail and as a result may require a restart of the WAC service if the UI becomes unresponsive.

The dashboard page shows general status of the clustered components including options to start, stop, remove and simulate failures.

Many of the page tabs are fairly basic at the moment, so WAC doesn’t yet replace any MMC counterpart for full functionality.

Similar to the Virtual Machine page in the new Server Manager, the dialog here should be familiar although now we see which host server is running a particular VM in a clustered state. There is still this split brain problem in Hyper-V clusters where VMs are ‘optionally’ clustered or left local if you want. If you are running a cluster your VMs should be part of the cluster, storage resiliency is only possible if the VM lives on clustered storage. In the split brain model I now have 2 classifications of VMs, clustered or not and still require 2 distinct tools to manage each: Failover Cluster Manager for clustered VMs, Server Manager for non clustered VMs. I doubt this will change any time soon.

Other Items of Note

No love for IE. I got this somewhat hilarious error suggesting that I install Chrome or Edge to use Admin Center on the server itself, considering Server 2016 ships with IE only by default. Most will manage remotely but it would sure be nice to be able to do SOMETHING locally if I needed to without having to install another browser! Just another nail in the coffin. RIP IE.

The need to re-authenticate is definitely excessive, over and over and over again. Every piece part that you connect to, even sub-elements on particular pages sometimes prompted additional challenges for authentication. Even after entering explicitly defined admin credentials for “all connections” I was still prompted continuously to authenticate. In a large environment I would be tearing my hair out. This must be resolved!

Watch this space, managing Windows Server is about to change in a big way!

Minecraft LAN Gaming on Windows10

Everybody loves Minecraft, especially your kids. They can play together easily using split screen on the PS4 but what if your kids are like mine and prefer to play on the PC? They can always find each other on a public server like Hypixel with other people on the internet, but sometimes it’s more fun to play together locally on the private LAN. This guide will provide the steps necessary to safely enable Minecraft LAN gaming without having to disable their firewalls. This has come up several times for me personally so time to document the steps.
So how does this work and what are the problems in native mode? Minecraft LAN mode takes a world from one hosting PC and makes it accessible to other Minecraft clients on the local network. As you have probably discovered, this doesn’t work at all if you just open up a game and start a LAN world. The joining PC you hope to share with just can’t see the world to join, resulting in a screen similar to this:

The problem here is that the hosting PC is successfully sharing the game but the joining PC can’t see it because the inbound traffic is being blocked by the firewall on the joining PC.

Network Profiles

The Windows 10 firewall works by shifting rule sets tied to specific network profiles, Public, Private and Domain. These profiles will take affect and do different things depending on the network you are attached to. By default, Win10 is configured in “shields up mode” with the network adapter set to the “public” firewall profile which is the most restrictive. While this is appropriate for public places or other people’s houses, I recommend changing this to the “private” profile, especially if on your trusted home LAN. This step is optional but makes general consumption of resources on your home network much easier and is relevant to the firewall rules we will enable in the next step. This step can be performed on all PCs on your local network.
First, while logged in with an administrator account, click the Wifi icon in the system tray next to the clock, then click the Properties link below your active connection.

This will open the Win10 settings dialog with more options, click the connection itself beneath the Wi-Fi toggle.

On the next page, click the “Private” radial button to switch the network profile. Important to note that if you access this page while running as a non-administrative user, you will not see this option.


Firewall Rules for Minecraft

Now that we have changed the firewall profile, we need to enable some special firewall rules on each joining PC. Important to note that any PC that wants to be a joining PC will need these rules in place. The key to enabling LAN gaming is by enabling a very specific Java executable through the firewall on the joining PC(s), as the PC hosting the game is initiating an outbound connection which will be allowed out by default. First, find the directory path that houses “javaw.exe”, this will vary depending on the JRE version you have installed but notice that this executable lives within the Minecraft program file space directly. The full path in this example is: C:\program files (x86)\minecraft\runtime\jre-x64\1.8.0_25\bin\javaw.exe.

Next, open the “Windows Defender Firewall with Advanced Security” app either as an administrator or right-click and choose “run as administrator”. Click the “Inbound Rules” element then in the center pane, look for 4 Java(TM)… rules that should have been created when the game was installed. You should see 2 rules for Public and 2 rules for Private profiles. Each rule set contains a rule to allow TCP connections and another for UDP connections solely for Javaw.exe. By default these rules are created and enabled but the connection is specifically blocked, hence the no symbol icon next to each.

To enable the connections, open each rule individually as appropriate for the active profile you have in place. If you followed the steps above, you will need to change the Private profile rules. On the General tab of the rule, select the “Allow the connection” radial.

If you click over to the Programs and Services tab, you will notice that the specific program specified in these rules is javaw.exe. Click OK to save the rule.

Once the rules are properly modified, you should see a green check icon next to each in the Inbound Rules list. This shows that the connection is allowed and that both rules are enabled for the Private profile. If you have the need to enable these rules for the Public profile, repeat these steps.

If you do not see these rules in your list by default, not to worry, we will create a new rule to cover the same actions. Right-click the Inbound Rules element in the left pane and select “New Rule”.  Choose “Program” on the rule type page, then browse to Javaw.exe in the directory identified previously for the program path.


Select to allow the connection on the next page, then select the network profiles to which the rule should apply. If you or your kiddo will go to other untrusted networks (friends houses) to play Minecraft, you may want to enable the public profile here as well. Finally, give the new rule a name and click Finish to enable the rule.


Start the LAN Gaming

To begin, from the hosting PC start a Singleplayer game and load the world you wish to share, in this example we’ve selected “#Building World”:

Once the map loads, press ESC to bring up the game menu and select “Open to LAN”. Next, choose the game mode for the session and whether to allow cheats, click “Start LAN World” when ready.


From the joining PC, start Minecraft using the “Multiplayer” option. You should now see any public servers your have configured as well as the game hosted on the LAN. Join the server and PROFIT.

Resources

They Talk too Much!

Resource Sharing in Server2016 RDSH

I first explored this topic several years ago for Server 2012 which remained applicable through the R2 lifecycle. Now with Server 2016 RDS alive and well, let’s see if anything has changed. What was true then is also true now and way back before when this was known as Terminal Services: a host’s physical or virtual resources are shared to several simultaneously connected users, each of which executing applications installed locally on the server. Remote Desktop Session Host, or RDSH, is what we call “session based” virtualization meaning that each user is essentially provided apps or a full desktop experience, but each user is simply a remote session, all existing within a single Windows Server OS. An RDSH host can be physical or virtual, virtual being more common now as you get the additional benefits of virtualization including clustering and HA. This is in stark contrast to desktop virtualization, aka VDI, in which each user is assigned a pooled or persistent desktop VM that has dedicated hardware resources provisioned from a server hypervisor. RDSH works great for application virtualization the likes of office and web apps. In short, RDSH = a single Server OS that users connect to, all CPU and RAM shared amongst all. Desktop virtualization = several desktop VMs each with their own assigned CPU and RAM.

What comes with Windows Server?

Starting in Server 2008R2, a feature called Dynamic Fair Share Scheduler was introduced which aimed to proactively and dynamically distribute CPU time based on the number of active sessions and load on each. After all, CPU is the resource consistently hit hardest in this use case. Additional drivers were added in Server 2012 to fairly share network and disk utilization, but not memory. This all remains true in Server 2016 with no apparent changes to the base mechanisms. Ultimately if memory sharing between user sessions in RDSH presents a challenge for you, based on user or application behavior, adding third-party tools or Hyper-V + desktop VMs may be a better option. That said, since your RDSH environment will likely be virtual, these elements are controlled on a per RDSH server VM basis. So balancing user load between these RDSH instances is the more important concern as no single server instance will be allowed to overwhelm the host server.
The CPU scheduler can be controlled via group policy, which is enabled by default, but not disk or network, also enabled by default.

This GPO element toggles the switch found in the registry at \HKLM\System\CurrentControlSet\Control\Session Manager\Quota system:

The other Fair Share components, can be found in the registry as well in a different location, each provide a binary on/off switch.

These elements can also be controlled via PowerShell through the command (gwmi win32_terminalservicesetting -N “root\cimv2\terminalservices”). Here I have DFSS disabled but disk and network enabled. Not sure why network shows no value here:

Test Scenario: CPU Fair Share

The output below was generated using the following configuration. Please note this does not represent an optimal or recommended RDSH configuration, it is intentionally low spec to easily showcase this scenario:

  • Host: Dell EMC PowerEdge R630
  • Hypervisor: Server 2016 Hyper-V Datacenter
  • RDSH: 1 x Server 2016 VMs configured with 1 vCPU/ 4GB RAM
  • Users: 3 total sessions represented by RDP-TCP, ICA-CGP/ pfine/b/c in the graph
  • Workload: Prime95 blend option
  • Monitoring: Perfmon captures from RDSH1 VM

This run demonstrates three user sessions executing Prime95, I spaced launches a few seconds apart, ending with all three competing for maximum CPU. As you can see, DFSS does its thing to limit CPU, 50% at two users, 33% once all three are active.

image
Network and disk IO fair share will work similarly should contention arise in those resources. So in a very basic form, as is the case with most Windows-included services, Microsoft gives you the bare functional minimum, which indeed works as intended. To take this functionality any further, you have to look to the partner ecosystem.

What about Citrix?

Citrix offers a number of products and services famously targeted at the EUC space, most notably XenApp and XenDesktop. Speaking of RDSH and user session/ application virtualization specifically, XenApp essentially encompasses the connection of your RDSH VMs running the Citrix VDA (Virtual Delivery Agent) to the Citrix management infrastructure. “XenApp” is the larger holistic solution which includes connection brokering, policies and management. For app and session delivery alone, you still need the RDSH role installed on Windows Server but run the VDA in addition on each instance. Previously resource management was enabled via policies in Studio but this has since migrated to Citrix Workspace Environment Management (WEM), which is the result of the recent Norskale acquisition and now represents the primary Citrix UEM tool. WEM does a whole lot more than resource management for RDSH, but for the context of this post, that’s where we’ll focus. WEM is available to XenApp & XenDesktop Enterprise or Platinum customers which you can read more about here.
WEM requires a number of components on its own, including Infrastructure Services (SQL DB, SyncFx), an agent for each RDSH instance and a management console. WEM includes a utility to create the database, another console for the infrastructure service configuration and finally another console to manage WEM as applied to the XenApp infrastructure. Once everything is created, talking and operational, WEM will require access to a valid Citrix license server before you can use it. Needless to say, WEM is usable only within a Citrix infrastructure.
To get started, make sure your agents are talking to your broker, which is set via GPO on the computer objects of your RDSH VMs. The requisite ADMX file is included with the installation media. Verify in the WEM management console under the Administration tab: Agents. If you don’t see your RDSH instances here, WEM is not working properly.

WEM provides a number of ways to control CPU, memory and IO utilization controlled by configuration sets. Servers are placed into configuration sets which tells the installed WEM agents which policies to apply, an agent can only belong to one set. If you want a certain policy to apply to XenApp hosts and another to apply for XenDesktop hosts, then you would create a configuration set for each housing the applicable policies. For this example, I created a configuration set for my RDSH VMs which will focus on resource controls.
The System Optimization tab houses the resource control options, starting with CPU, provides high level to more granular controls. At a very basic level, CPU spike protection is intended to ensure that no process, unless excluded, will exceed the % limits you specify. Intelligent CPU and IO optimization, highlighted below, causes the agent to keep a list of processes that trigger spike protection. Repeat offenders are assigned a lower CPU priority at process launch. That is the key part of what this solution does: offending processes will have their base priority adjusted so other process can use CPU.

To show this in action, I ran Prime95 in one of my XenApp sessions. As you can see below the Prime95 process is running with a normal base priority and happily taking 100% of available CPU.

Once CPU Spike protection is enabled, notice the prime95 process has been changed to a Low priority but it isn’t actually limited to 25% according to my settings. What this appears to do in reality, is make problem processes less important so that others can take CPU time if needed, but no hard limit seems to be actually enforced. I tried a number of scenarios here including process clamping, varying %, optimized vs non, all in attempts to force Prime95 to a specific % of CPU utilization. I was unsuccessful. CPU utilization never drops, other processes are allowed to execute and share the CPU, but this would happen normally with DFSS.

I also tried using the CPU Eater process Citrix uses in their videos thinking maybe Prime95 was just problematic, but if you notice even in their videos, it does not appear that the policy ever really limits CPU utilization. The base priority definitely changes so that part works, but “spike optimization” does not appear to work at all. I’d be happy to be proven wrong on this if anyone has this working correctly.

For memory optimization, WEM offers “working set optimization” which will reduce the memory working set of particular processes once the specified idle time has elapsed. Following the Citrix recommendation, I set the following policy of 5 minutes/ 5%.

To test this, I opened a PDF in Chrome and waited for optimization to kick in. It works! The first image shows the Chrome process with the PDF first opened, the second image shows the process after optimization has worked its magic. This is a 99% working set memory reduction, which is pretty cool.


The IO Management feature allows the priorities of specific processes to be adjusted as desired, but not specifically limited by IO.

What about Citrix XenApp in Azure?

XenApp can also be run in Microsoft Azure via the Citrix XenApp Essentials offer. After the requisite Azure and Citrix Cloud subscriptions are established, the necessary XenApp infrastructure is easily created from the Compute catalog directly in Azure. The minimum number of users is 25 but your existing RDS CALs can be reused and Citrix billing is consolidated on your Azure bill for ease. Azure provides a number of global methods to create, scale, automate and monitor your environment. But at the end of the day, we are still dealing with Windows Server VMs, RDSH and Citrix Software. All the methods and rules discussed previously still apply, with one important exclusion: Citrix WEM is not available in Azure/ Citrix Cloud, so DFSS is your best bet unless you turn to supported third-party softs.

Once the XenApp infrastructure is deployed within Azure, the Citrix Cloud portal is then used to manage catalogs, resource publishing and entitlements.

What about VMware?

VMware also provides a number of methods to deploy and manage applications, namely: ThinApp, AirWatch and App Volumes while providing full integration support for Microsoft RDSH via Horizon or Horizon Apps.  For those keeping count, that’s FOUR distinct methods to deploy applications within Horizon. Similar to Citrix, VMware has their own UEM tool called… VMware UEM.  But unlike Citrix, the VMware UEM tool can only be used for user and application management, not resource management.

While Horizon doesn’t provide any RDSH resource-optimizing capabilities directly, there are a few settings to help reduce resource intensive activities such as Adobe Flash throttling which will become less compelling as the world slowly rids itself of Flash entirely.

Something else VMware uses on RDSH hosts within a Horizon environment is memory and CPU loading scripts. These VBscripts live within C:\Program Files\VMware\VMware View\Agent\scripts and are used to generate Load Preference values that get communicated back to the Connection Servers. The reported value is then used to determine which RDSH hosts will be used for new session connections. If CPU or memory utilization is already high on a given RDSH host, VCS will send a new connection to a host with a lower reported load.

What about VMware Horizon in Azure?

VMware Horizon is also available in Azure via Horizon Cloud and has a similar basic architecture to the Citrix offer. Horizon Cloud acts as the control plane and provides the ability to automate the creation and management of resources within Azure. VMware has gone out of their way to make this as seamless as possible, providing the ability to integrate multi-cloud and local deployments all within the Horizon Cloud control plane, thus minimizing your need to touch external cloud services. From within this construct you can deploy applications, RDSH sessions or desktop VMs.

Horizon Cloud, once linked with Azure, provides full customized deployment options for RDSH farms that support delivery of applications or full session desktops. Notice that when creating a new farm, you are provided an option to limit the number of sessions per RDSH server. This is about it from a resource control perspective for this offer.


What about third party options?

Ivanti has become the primary consolidation point for predominant EUC-related tooling, most recently and namely, RES Software and AppSense. The Ivanti Performance Manager (IPM) tool (formerly AppSense Performance Manager) appears to be the most robust resource manager on the market today and has been for a very long time. IPM can be used not only for granular CPU/ memory throttling on RDSH but any platform including physical PCs or VDI desktops. I didn’t have access to IPM to demo here, so the images below are included from Ivanti.com for reference.

IPM provides a number of controls for CPU, memory and disk that can be applied to applications or groups, including those that spawn multiple chained processes with a number of options to dial in the desired end state. Performance Manager has been a favorite for RDSH and XenApp environments for the better part of a decade and for good reason it seems.

Resources

Citrix WEM product documentation: https://docs.citrix.com/en-us/workspace-environment-management/current-release.html
A year of field experience with Citrix WEM: https://youtu.be/tFoacrvKOw8
Citrix XenApp Essentials start to finish: https://youtu.be/5R-yZcDJztc
Horizon Cloud & Azure: https://youtu.be/fuyzBuzNWnQ
Horizon Cloud Requirements: http://www.vmware.com/info?id=1434
Ivanti Performance Manager product guide: https://help.ivanti.com/ap/help/en_US/pm/10.1/Ivanti%20Performance%20Manager%2010.1%20FR4%20Product%20Guide.pdf

Google Wifi Behind a Firewall


More specifically behind a FIOS firewall but really much of the information below applies to any firewall you might put Google Wifi behind. I’ll dig into what you need to know and how to make some key services work while buried in a double-NAT, double firewall deployment.
Google Wifi (gWifi) is a relatively new mesh networking solution from Google that has a simple goal: Provide stupid easy, crazy fast, blanketed wifi coverage for your entire house regardless of size. This is done via very small (4.17” diameter) but very aesthetically pleasing Wifi “Points”, as Google calls them, that you place in key areas of your home to provide coverage. One Wifi Point will act as primary and connect via a BaseT Ethernet cable to your existing modem or router. The other Points will connect to the primary wirelessly and expand the signal of a single Wireless LAN (WLAN). The gWifi solution operates on both the 2.4GHz and 5GHz bands but unlike most other wireless routers, gWifi enables seamless and automatic switching between the bands as required, using a single SSID. Every client available today is supported here: 802.11a/b/g/n/ac. No need to set up and manually switch between discrete SSIDs for each band. gWifi will place your device on the best possible band given its capabilities and proximity to the gWifi Points.

Easily one the prettiest networking devices around

With the primary router cabled to the FIOS router, there is one additional switched Ethernet port available on that device and two ports available in each secondary mesh Point for wired Ethernet clients. Need more coverage? Add more gWifi Points. Unlike most routers there is no web interface here to access for management, you must use the gWifi app installed on your mobile device. The available features are intentionally limited to keep ease of use high, so those looking for advanced features like VPN may not find what they need here. Luckily, everything I need appears to be intact: custom DNS, DHCP reservations and port forwarding. Another important callout is that you cannot currently change the IP range that gWifi uses for DHCP assignment, it is and always will be 192.168.86.0/24. If this range is already in use on your network for some reason, gWifi will shift to 192.168.85.0/24. **Update – Google has now made it possible to change both the router LAN address as well as the DHCP pool range, so .86 is no longer required. If you don’t care or have a good reason to change, honestly, just leave the default.

General setup is fairly simple: Connect an Ethernet cable to the WAN port of your primary gWifi Point from the switch side of your modem or firewall and power on. Download the gWifi app to your phone or tablet, find the device and follow the prompts to configure. Additional Points are easily added through the setup process which will help to ensure ideal placement for maximum coverage. Connect your wireless clients to the new network like normal and you’re done. The rest of this post will dig into more advanced topics around presenting services connected to the gWifi network out to the internet, or to clients connected to the FIOS network.

View of my gWifi mesh network

Network Architecture

In Google’s Wifi documentation, the clear preferred deployment model is the Google router connected directly to a broadband modem. This enables Google Wifi to be the primary router, AP and firewall of the house brokering all connections to the internet. Well, what if you don’t have a cable modem because you have FIOS or similar service? Or don’t really want gWifi as your barrier to the big bad web? In my particular case I use FIOS for internet access only, my TV service is provided via PlayStation Vue so I have no Set Top Boxes (STB) and my phone service is provided by Ooma. For those of us with FIOS, we have ONT boxes in our garages that connect to a router inside the house. If you have speeds >100Mbps this connection is made using a Cat5e cable instead of coax for lower speeds. I’ve read that while it appears possible to successfully replace the FIOS router with gWifi, there are some mixed results doing this. Really, this should only be considered if you are an internet-only customer in my view. If you have STBs, this won’t work as you need a coax connection between them and the router to complete the MoCa network. The easiest thing to do is simply leave the FIOS router in place as is and install the gWifi pieces behind it.
What this will create, is 2 stateful firewalls, directly connected LAN to WAN, each with their own separate subnets, with the Google device having a leg in both networks. Leave DHCP enabled on the FIOS router to serve the clients directly connected via the Ethernet switch, including the WAN port of the Google router. There is no way currently to manually specify a static IP address for the gWifi router, so it must receive via DHCP.
Important to note that the gWifi router can be put into bridge mode, thus making your FIOS router ‘primary’ but doing so will disable the mesh capabilities of the gWifi system. Only do this if you have a single gWifi router or knowingly want to disable mesh (why buy gWifi??).

The diagram below displays my home network and how I installed the gWifi system. The FIOS router is still my primary firewall and gateway to the internet, everything ultimately connects behind this device. I have a few devices that connect directly to the FIOS network and a 1Gb run that goes between floors that feeds the primary gWifi router from the FIOS router. The only device I have currently hard wired to the gWifi network is my media server (Plex/ NAS). This gives me 1Gb wired end to end from my PC to my NAS downstairs. All other devices like my PS4, Smart TVs, kid and Chromecast devices connect via wifi. The gWifi devices are depicted as G1, G2 and G3 below.

You’ll notice that the G1 router depicted above, has two IP addresses, 192.168.1.22 on the WAN side and 192.168.86.1 on the LAN side. The .22 address was assigned via DHCP from the FIOS router which I reserved so the G1 device will always receive this IP. This is important as we will configure an upstream static routing rule later that will point to this address, so we need it to not change. The gWifi routers will assign all IPs to all clients they service directly, wired or wireless. The G2 and G3 routers simply serve as extensions of G1 and will serve any clients that connect via proximity. By default, any device attached to the FIOS network (192.168.1.0) will have no knowledge of the .86 network, nor how to get to anything that lives there. So we have to tell the FIOS router how to find the .86 network, if I ever want my PC to connect to file shares hosted my my NAS, for example.

The main configuration activities I’ll cover here are:

  • Reserving IP addresses
  • Routing between networks
  • Port Forwarding key services
  • Configuring the Windows Firewall
  • Plex remote access

Reserving IP Addresses

In FIOS

First, find the IP assigned to the WAN side of the Google router via the gWifi app under Network Device Settings: Settings > Network & general > wifi points > [primary device] :

Login to the FIOS router and navigate to: Advanced > IP Address Distribution, then click the “Connection List” button. Find the gWifi WAN IP assignment in the connection list, click the pencil to edit and check the box to set the “Static Lease type”. This will ensure that the Google WAN port will always receive this IP.

In gWifi

Port forwarding rules can only be applied to reserved IP addresses, so lock in any PCs or Servers you intend to be configured with rules. To reserve an IP address assigned to any client on the gWifi network, open the app and navigate to: Network & general > Advanced networking > DHCP IP reservations and tap the green + button in the lower corner. Select the chosen device in the list and tap next. The MAC address and type of device is displayed, along with the gWifi Point to which the device is attached. Accept the current IP assignment or change it to suit your needs and tap next to save. 

Routing

As the network exists right now, my PC can’t reach my media server on the .86 network as it doesn’t know how to get there. I could add a persistent route on my PC which would solve the problem for my PC, but a better option would be to configure a global routing rule on the FIOS router. This will enable any client on the FIOS network to be able to connect to the hosts or clients on the gWifi network. Let the router do its job: route traffic. The WAN port of the gWifi router is the gateway for any traffic destined to the .86 network. All traffic in or out of the .86 network will pass through this port. So my routing rule needs to send all traffic from the 192.168.1.0/24 network destined for the 192.168.86.0/24 network to 192.168.1.22. To illustrate this further, the image below depicts the connection from my PC to the the media server and associated hops along the way:

On the FIOS router, navigate to Advanced > Routing and click the “New Route” link in red. Enter the pertinent details and click apply. Traffic is now flowing in the right directions.

Port Forwarding

All network-accessible services, running on a PC or server, listen for connections via network ports, opened within those applications. TCP and UDP protocols with specific port numbers are assigned to applications and made available for access, such as HTTP (web server) listening on TCP 80. For my scenario, I have several ports that I need to open from my media server to make accessible to my PC. Per the diagram below, TCP 445 = SMB (file services), TCP 3389 = RDP and TCP 32400 = Plex server. Anything on the gWifi network that you wish to expose to the internet will need to be port forwarded on both the gWifi and FIOS routers, unless it advertises itself as a UPnP (Universal Plug and Play) capable service that can set its own rule on the router, which gWifi will allow. Plex happens to be one of those services, so TCP 32400 is automatically opened through the gWifi router. Currently there is no way to view or control UPnP-configured rules in the gWifi app, so you could have a slew of ports opened and not even know it. The only option at the moment is to disable UPnP entirely within the gWifi app. Hopefully Google will fix this in the near future.

The other two ports to be opened are done so with manual port forwarding rules in the gWifi app. Navigate to: Network & general > Advanced networking > Port forwarding and tap the green + button. Choose a device to forward a port from, which will only be possible if you reserved the IP address on that device. Select TCP, UDP or both as well as the internal and external ports. Both are required here. Tapping done will create the rule and set it as active.  


After this step all required rules are in place on both the FIOS and gWifi router and the media server is accessible from the FIOS network. The image below shows everything configured so far along with the traffic flow.

Windows Firewall

Because my media server is a Windows box, if you need to access resources connected to the gWifi network such as NAS or Plex, you must allow these connections through the Windows firewall. By default, the Windows Firewall blocks all inbound connections unless a specific rule exists otherwise. Create a new custom firewall rule on the PC or server allowing traffic from the gateway of the FIOS network: 192.168.1.1/24. This will treat all traffic sourced from the FIOS network as trusted. Remember this entire network segment is already behind a firewall to the internet, the FIOS router. So you can safely port forward hosts on the gWifi network to the inside of the FIOS network.  The new rule should be custom allowing all programs and all ports when applied to the remote IP address of the FIOS router. If you want to get more granular and only allow access to the specific ports you are exposing, that is an option as well.

Plex Remote Access

One additional step is required if you want to configure Plex with remote access. An additional port must be forwarded out from the FIOS router to allow an internal connection to TCP 32400. Log into the FIOS router and navigate to Firewall Settings > Port Forwarding. Add a new rule and make sure to click the Advanced button. Enter the IP addresses, ports and dropdowns per the screenshot below. Choose specify IP, enter the IP address of the Plex server, forward to port 32400. For the destination port, which is what will be exposed to the internet, you can either custom create the number or match the random 5-digit port generated in the Plex settings. Either way, these port numbers must match between the Plex server and the FIOS router. It’s probably best to not expose TCP 32400 directly to the internet. I don’t know of a Plex specific exploit but the service behind this port is well known so best not to advertise what it is.


Once the rule is in place and active, the Plex service should report as fully accessible. If the following dialog reports any issues, try specifying a manual public port and recreate the port forwarding rule on the FIOS router.

image

The diagram below depicts the remote access connection originating on the public internet, forwarding to the Plex service inside through both routers. Now your Plex server is accessible from anywhere on the internet. Remember that the public port can be any number you want.

image

Final Thoughts

Overall my experience with the gWifi system has been quite good. Elegant, unobtrusive, high performance and so simple. There’s a lot of high-end competition in the mesh wifi business right now and Google does a really good job, assuming you don’t require too many advanced features. Google also includes some decent performance testing tools in the gWifi app so you can gauge the performance of the speed to the internet, the wifi clients and the mesh itself as well as figure out where any problems might lie.
   

You can view a device’s network consumption real time and shut down any client you choose or give that device network priority for up to 4 hours. Being able to group and schedule internet access for particular devices is especially useful as a parent. If you have Sonos in the house, make sure to setup all devices using Standard mode connected to the new gWifi network. Boost mode will still work if required, but make sure to keep all devices on the same network for ease of interoperability. It appears problematic to have a controller on the other side of a firewall with all the Sonos devices behind it, due to the number of ports and connections required.

VMware vSphere HA Mode for vGPU

The following post was written and scenario tested by my colleagues and friends Keith Keogh and Andrew Breedy of the Limerick, Ireland CCC engineering team. I helped with editing and art. Enjoy.

VMWare has added High Availability (HA) for virtual machines (VM’s) with an NVIDIA GRID vGPU shared pass-through device in vSphere 6.5. This feature allows any vGPU VM to automatically restart on another available ESXi host with an identical NVIDIA GRID vGPU profile if the VM’s hosting server has failed. 
To better understand how this feature would work in practice we decided to create some failure scenarios. We tested how HA for vGPU virtual machines performed in the following situations:
1)  Network outage: Network cables get disconnected from the virtual machine host.
2)  Graceful shutdown: A host has a controlled shut down via the ESXi console.
3)  Power outage: A host has an uncontrolled shutdown, i.e. the server loses AC power.
4)  Maintenance mode: A host is put into maintenance mode.

The architecture of the scenario used for testing was laid out as follows:  

ao

Viewed another way, we have 3 hosts, 2 with GPUs, configured in an HA VSAN cluster with a pool of Instant Clones configured in Horizon.

clus1
image

1)  For this scenario, we used three Dell vSan Ready Node R730 servers configured per our C7 spec, with the ESXi 6.5 hypervisor installed, clustered and managed through a VMWare vCenter 6.5 appliance.
2)  VMWare VSAN 6.5 was configured and enabled to provide shared storage.
3)  Two of the three servers in the cluster had an NVIDIA M60 GPU card and the appropriate drivers installed in these hosts. The third compute host did not have a GPU card.
4)  16 vGPU virtual machines were placed on one host. The vGPU VM’s were a pool of linked clones created using VMWare Horizon 7.1. The virtual machine Windows 10 master image had the appropriate NVIDIA drivers installed and an NVIDIA GRID vGPU shared PCI pass through device added.
5)  All 4GB of allocated memory was reserved on the VM’s and the M60-1Q profile assigned which has a maximum of 8 vGPU’s per physical GPU. Two vCPU’s were assigned to each VM.
6)  High Availability was enabled on the vSphere cluster.

Note that we intentionally didn’t install an M60 GPU card in the third server of our cluster. This allowed us to test the mechanism that allows the vGPU VM’s to only restart on a host with the correct GPU hardware installed and not attempt to restart the VM’s on a host without a GPU. In all cases this worked flawlessly, the VM’s always restarted on the correct backup host with the M60 GPU installed.

s1

Scenario One

To test the first scenario of a network outage we simply unplugged the network cables from the vGPU VM’s host server. The host showed as not responding in the vSphere client and the VM’s showed as disconnected within a minute of unplugging the cables.  After approximately another 30 seconds all the VM’s came back online and restarted normally on the other host in the cluster that contained the M60 GPU card.

Scenario Two
s2

A controlled shutdown down of the host through ESXi worked in a similar manner. The host showed as not responding in the vSphere client and the VM’s showed as disconnected as the ESXi host began shutting down the VSAN services as part of ESXi’s shutdown procedure. Once the host had shut down, the VM’s restarted quite quickly on the backup host. In total, the time from starting the shutdown of the host until the VM’s restarted on the backup host was approximately a minute and a half.

s3

Scenario Three

To simulate a power outage, we simply pulled the power cord of the vGPU VM’s host. After approximately one minute the host showed as not responding and the VM’s showed as disconnected in the vSphere client. Roughly 10 seconds later the vGPU VM’s had all restarted on the back up host.

s4

Scenario Four

Placing the host in maintenance mode worked as expected in that any powered on VMs must first be powered off on that host before completion can occur. Once powered off, the VM’s were then moved to the backup host but not powered on (the ‘Move powered-off and suspended virtual machines to other hosts in the cluster’ option was left ticked when entering maintenance mode). The vGPU-enabled VM’s were moved to the correct host each time we tested this: the host with the M60 GPU card.

In conclusion, the HA failover of vGPU virtual machines worked flawlessly in all cases we tested. In the context of speed of recovery, we made the following observations with regard to the scenarios tested. The unplanned power outage test recovered the quickest at 1 minute 10 seconds followed by the controlled shutdown, with the network outage taking slightly longer again to recover.

Failure ScenarioApproximate Recovery Time
Network Outage1 min, 30 sec
Controlled Shutdown1 min, 30 sec
Power Outage1 min, 10 sec

In a real world scenario the HA failover for vGPU VM’s would of course require an unused GPU card in a backup server for it to work. In most vGPU environments you would probably want to fill the GPU to its maximum capacity of vGPU based VM’s to gain maximum value from your hardware. In order to provide a backup for a fully populated vGPU host, it would mean having a fully unused server and GPU card lying idle until circumstances required it. It is also possible to split the vGPU VM’s between two GPU hosts, placing, for example 50% of the VM’s on each host. In the event of a failure the VM’s will failover to the other host. In this scenario though, each GPU would be used to only 50% of its capacity.

An unused back-up GPU host may be ok in larger or mission critical deployments but may not be very cost effective for smaller deployments. For smaller deployments it would be recommended to leave a resource buffer on each GPU server so that if there was a host failure, there is room on the GPU enabled server to facilitate these vGPU Enabled VM’s.

The Native MSFT Stack: S2D & RDS – Part 3

Part 1: Intro and Architecture
Part 2: Prep & Configuration
Part 3: Performance & Troubleshooting (you are here)
Make sure to check out my series on RDS in Server 2016 for more detailed information on designing and deploying RDSH or RDVH.

Performance

This section will give an idea of disk activity and performance given this specific configuration as it relates to S2D and RDS.
Here is the 3-way mirror in action during the collection provisioning activity, 3 data copies, 1 per host, all hosts are active, as expected:

Real-time disk and RDMA stats during collection provisioning:

RDS provisioning isn’t the speediest solution in the world by default as it creates VMs one by one. But it’s fairly predictable at 1 VM per minute, so plan accordingly.

Optionally, you can adjust the concurrency level to adjust the number of VMs RDS can create in parallel by using the Set-RDVirtualDesktopConcurrency CMDlet. Server 2012R2 supported a max of 20 concurrent operations but make sure the infrastructure can handle whatever you set here.

Set-RDVirtualDesktopConcurrency –ConnectionBroker “RDCB name” –ConcurrencyFactor 20

To illustrate the capacity impact of 3-way mirroring, take my lab configuration which provides my 3-node cluster with 14TB of total capacity, each node contributing 4.6TB. I have 3 volumes fixed provisioned totaling 4TB with just under 2TB remaining. The math here is that of my raw capacity, 30% is usable, as expected. This equation gets better at larger scales, starting with 4 nodes, so keep this in mind when building your deployment.

Here is the disk performance view from one of the Win10 VMs within the pool (VDI-23) running Crystal DiskMark, which runs Diskspd commands behind the scenes. Read IOPS are respectable at an observed max of 25K during the sequential test.

image_thumb[3]

Write IOPS are also respectable at a max observed of nearly 18K during the Sequential test.

image_thumb[4]

Writing to the same volume, running the same benchmark but from the host itself, I saw some wildly differing results. Similar bandwidth numbers but poorer showing on most tests for some reason. One run yielded some staggering numbers on the random 4K tests which I was unable to reproduce reliably.

image_thumb[5]

Running Diskspd tells a slightly different story with more real-world inputs specific to VDI: write intensive. Here given the punishing workload, we see impressive disk performance numbers and almost 0 latency. The following results were generated from a run generating a 500MB file, 4K blocks weighted at 70% random writes using 4 threads with cache enabled.

Diskspd.exe -b4k -d60 -L -o2 -t4 -r -w70 -c500M c:\ClusterStorage\Volume1\RDSH\io.dat
image_thumb[6]

Just for comparison, here is another run with cache disabled. As expected, not so impressive.

image_thumb[8]

Troubleshooting

Here are a few things to watch out for along the way.
When deploying your desktop collection, if you get an error about a node not having a virtual switch configured:

One possible cause is that the default SETSwitch was not configured for RDMA on that particular host. Confirm and then enable per the steps above using Enable-NetAdapterRDMA.

On the topic of VM creation within the cluster, here is something kooky to watch out for. If working on one of your cluster nodes locally and you try to add a new VM to be hosted on a different node, you may have trouble. When you get to the OS install portion where the UI offers to attach an ISO to boot from. If you point to an ISO sitting on a network share, you may get the following error: Failing to add the DVD device due to lack of permissions to open attachment.

You will also be denied if you try to access any of the local paths such as desktop or downloads.

The reason for this is that the dialog is using the remote browser for file access on the server you are creating the VM. Counter-intuitive perhaps but the work around is to either log into the host where the VM is to be created directly or copy your ISO local to that host. 

Watch this space, more to come…

Part 1: Intro and Architecture
Part 2: Prep & Configuration
Part 3: Performance & Troubleshooting (you are here)

Resources

S2D in Server 2016
S2D Overview
Working with volumes in S2D
Cache in S2D

The Native MSFT Stack: S2D & RDS – Part 2

Part 1: Intro and Architecture
Part 2: Prep & Configuration (you are here)
Part 3: Performance & Troubleshooting
Make sure to check out my series on RDS in Server 2016 for more detailed information on designing and deploying RDSH or RDVH.

Prep

The number 1 rule of clustering with Microsoft is homogeneity. All nodes within a cluster must have identical hardware and patch levels. This is very important. The first step is to check all disks installed to participate in the storage pool, bring all online and initialize. This can be done via PoSH or UI.

Once initialized, confirm that all disks can pool:

Get-PhysicalDisk -CanPool $true | sort model

Install Hyper-V and Failover Clustering on all nodes:

Install-WindowsFeature -name Hyper-V, Failover-Clustering -IncludeManagementTools -ComputerName InsertName -Restart

Run cluster validation, note this command does not exist until the Failover Clustering feature has been installed. Replace portions in red with your custom inputs. Hardware configuration and patch level should be identical between nodes or you will be warned in this report.

Test-Cluster -Node node1, node2, etc -include "Storage Spaces Direct", Inventory, Network, "System Configuration"

The report will be stored in c:\users\\AppData\Local\Temp

Networking & Cluster Configuration

We’ll be running the new Switch Embedded Team (SET) vSwitch feature, new for Hyper-V in Server 2016.

Repeat the following steps on all nodes in your cluster. First, I recommend renaming the interfaces you plan to use for S2D to something easy and meaningful. I’m running Mellanox cards so called mine Mell1 and Mell2. There should be no NIC teaming applied at this point!

Configure the QoS policy, first enable the datacenter bridging (DCB) feature which will allow us to prioritize certain services the traverse the Ethernet.

Install-WindowsFeature -Name Data-Center-Bridging

Create a new policy for SMB Direct with a priority value of 3 which marks this service as “critical” per the 802.1p standard:

New-NetQosPolicy "SMBDirect" -NetDirectPortMatchCondition 445 -PriorityValue8021Action 3

Allocate at least 30% of the available bandwidth to SMB for the S2D solution:

New-NetQosTrafficClass "SMBDirect" -Priority 3 -BandwidthPercentage 30 -Algorithm ETS

Create the SET switch using the adapter names you specified previously. Items in red should match your choices or naming standards. Note that this SETSwitch is ultimately a vNIC and can receive an IP address itself:

New-VMSwitch -Name SETSwitch -NetAdapterName "Mell1","Mell2" -EnableEmbeddedTeaming $true

Add host vNICs to the SET switch you just created, these will be used by the management OS. Items in red should match your choices or naming standards. Assign static IPs to these vNICs as required as these interfaces are where RDMA will be enabled.

Add-VMNetworkAdapter –SwitchName SETSwitch –name SMB_1 –managementOS
Add-VMNetworkAdapter –SwitchName SETSwitch –name SMB_2 –managementOS

Once created, the new virtual interface will be visible in the network adapter list by running get-netadapter.

image_thumb

Optional: Configure VLANs for the new vNICs which can be the same or different but IP them uniquely. If you don’t intend to tag VLANs in your cluster or have a flat network with one subnet, skip this step.

Set-VMNetworkAdapterVLAN –VMNetworkAdapterName “SMB_1” –VlanId 00 –Access –ManagementOS
Set-VMNetworkAdapterVLAN –VMNetworkAdapterName “SMB_2” –VlanId 00 –Access –ManagementOS

Verify your VLANs and vNICs are correct. Notice mine are all untagged since this demo is in a flat network.

Get-VMNetworkAdapterVlan –ManagementOS
image_thumb1

Restart each vNIC to activate the VLAN assignment.

Restart-NetAdapter “vEthernet (SMB_1)”
Restart-NetAdapter “vEthernet (SMB_2)”

Enable RDMA on each vNIC.

Enable-NetAdapterRDMA “vEthernet (SMB_1)”, “vEthernet (SMB_2)”

Next each vNIC should be tied directly to a preferential physical interface within the SET switch. In this example we have 2 vNICs and 2 physical NICs for a 1:1 mapping. Important to note: Although this operation essentially designates a vNIC assignment to a preferential pNIC, should the assigned pNIC fail, the SET switch will still load balance vNIC traffic across the surviving pNICs. It may not be immediately obvious that this is the resulting and expected behavior.

Set-VMNetworkAdapterTeamMapping -VMNetworkAdapterName "SMB_1" -ManagementOS –PhysicalNetAdapterName “Mell1”
Set-VMNetworkAdapterTeamMapping -VMNetworkAdapterName "SMB_2" -ManagementOS –PhysicalNetAdapterName “Mell2”

To quickly prove this, I have my vNIC “SMB_1” preferentially tied to the pNIC “Mell1”. SMB_1 has the IP address 10.50.88.82

image_thumb3

Notice that even though I have manually disabled Mell1, the IP still responds to a ping from another host as SMB_1’s traffic is temporarily traversing Mell2:

image_thumb4

Verify the RDMA capabilities of the new vNICs and associated physical interfaces. RDMA Capable should read true.

Get-SMBClientNetworkInterface
image_thumb2

Build the cluster with a dedicated IP and slash subnet mask. This command will default to /24 but still might fail unless explicitly specified.

New-Cluster -name "Cluster Name" -Node Node1, Node2, etc -StaticAddress 0.0.0.0/24

Checking the report output stored in c:\windows\cluster\reports\, it flagged not having a suitable disk witness. This will auto-resolve later once the cluster is up.

The cluster will come up with no disks claimed and if there is any prior formatting, they must first be wiped and prepared. In PowerShell ISE, run the following script, enter your cluster name in the red text.

icm (Get-Cluster -Name S2DCluster | Get-ClusterNode) {
Update-StorageProviderCache


Get-StoragePool | ? IsPrimordial -eq $false | Set-StoragePool -IsReadOnly:$false -ErrorAction SilentlyContinue


Get-StoragePool | ? IsPrimordial -eq $false | Get-VirtualDisk | Remove-VirtualDisk -Confirm:$false -ErrorAction SilentlyContinue


Get-StoragePool | ? IsPrimordial -eq $false | Remove-StoragePool -Confirm:$false -ErrorAction SilentlyContinue


Get-PhysicalDisk | Reset-PhysicalDisk -ErrorAction SilentlyContinue


Get-Disk | ? Number -ne $null | ? IsBoot -ne $true | ? IsSystem -ne $true | ? PartitionStyle -ne RAW | % {


$_ | Set-Disk -isoffline:$false


$_ | Set-Disk -isreadonly:$false


$_ | Clear-Disk -RemoveData -RemoveOEM -Confirm:$false


$_ | Set-Disk -isreadonly:$true


$_ | Set-Disk -isoffline:$true


}


Get-Disk |? Number -ne $null |? IsBoot -ne $true |? IsSystem -ne $true |? PartitionStyle -eq RAW | Group -NoElement -Property FriendlyName


} | Sort -Property PsComputerName,Count

Once successfully completed, you will see an output with all nodes and all disk types accounted for.

Finally, it’s time to enable S2D. Run the following command and select “yes to all” when prompted. Make sure to use your cluster name in red.

Enable-ClusterStorageSpacesDirect –CimSession S2DCluster

Storage Configuration

Once S2D is successfully enabled, there will be a new storage pool created and visible within Failover Cluster Manager. The next step is to create volumes within this pool. S2D will make some resiliency choices for you depending on how many nodes are in your cluster. 2 nodes = 2-way mirroring, 3 nodes = 3-way mirroring, if you have 4 or more nodes you can specify mirror or parity. When using a hybrid configuration of 2 disk types (HDD and SSD), the volumes reside within the HDDs as the SSDs simply provide caching for reads and writes. In an all-flash configuration only the writes are cached. Cache drive bindings are automatic and will adjust based on the number of each disk type in place. In my case, I have 4 SSDs + 5 HDDs per host. This will net a 1:1 cache:capacity map for 3 pairs of disks and a 1:2 ratio for the last 3. Microsoft’s recommendation is to make the number of cache drives a multiple of the number of capacity drives, for simple symmetry. If a host experiences a cache drive failure, the cache to capacity mapping will readjust to heal. This is why a minimum of 2 cache drives per host are recommended.

Volumes can be created using PowerShell or Failover Cluster Manager by selecting the “new disk” option. This one simple PowerShell command does three things: creates the virtual disk, places a new volume on it and makes it a cluster shared volume. For PowerShell the syntax is as follows:

New-Volume –FriendlyName “Volume Name” –FileSystem CSVFS_ReFS –StoragePoolFriendlyName S2D* –size xTB

CSVFS_ReFS is recommended but CSVFS_NTFS may also be used. Once created these disks will be visible under the Disks selection within Failover Cluster Manager. Disk creation within the GUI is a much longer process but gives meaningful information along the way, such as showing that these disks are created using the capacity media (HDD) and that the 3-server default 3-way mirror is being used.

The UI also shows us the remaining pool capacity and that storage tiering is enabled.

Once the virtual disk is created, next we need to create a volume within using another wizard.  Select the vDisk created in the last step:

Storage tiering dictates that the volume size must match the size of the vDisk:

Skip the assignment of a drive letter, assign a label if you desire, confirm and create.


The final step is to add this new disk to a Cluster Shared Volume via Failover Cluster Manager. You’ll notice that the owner node will be automatically assigned:

Repeat this process to create as many volumes as required.

RDS Deployment

image_thumb[1]

Install the RDS roles and features required and build a collection. See this post for more information on RDS installation and configuration. There is nothing terribly special that changes this process for a S2D cluster. As far as RDS is concerned, this is an ordinary Failover Cluster with Cluster Shared Volumes. The fact that RDS is running on S2D and “HCI” is truly inconsequential.
As long as the RDVH or RDSH roles are properly installed and enabled within the RDS deployment, the RDCB will be able to deploy and broker connections to them. One of the most important configuration items is ensuring that all servers, virtual and physical, that participate in your RDS deployment, are listed in the Servers tab. RDS is reliant on Server Manager and Server Manager has to know who the players are. This is how you tell it.

To use the S2D volumes for RDS, point your VM deployments at the proper CSVs within the C:\ClusterStorage paths. When building your collection, make sure to have the target folder already created within the CSV or collection creation will fail. Per the example below, the folder “Pooled1” needed to be manually created prior to collection creation.

During provisioning, you can select a specific balance of VMs to be deployed the RDVH-enabled hosts you select, as can be seen below.

RDS is cluster aware in that the VMs it creates can be created as HA within the cluster and the RD Connection Broker (RDCB) remains aware as to which host is running which VMs should they move. In the event of a failure, VMs will be moved to a surviving host by the cluster service and the RDCB will keep track.

Part 1: Intro and Architecture
Part 2: Prep & Configuration (you are here)
Part 3: Performance & Troubleshooting

Resources

S2D in Server 2016
S2D Overview
Working with volumes in S2D
Cache in S2D

The Native MSFT Stack: S2D & RDS – Part 1

Part 1: Intro and Architecture (you are here)
Part 2: Prep & Configuration
Part 3: Performance & Troubleshooting
Make sure to check out my series on RDS in Server 2016 for more detailed information on designing and deploying RDSH or RDVH.

For Microsoft purists looking to deploy VDI or another workload on the native Microsoft stack, this is the solution for you!  Storage Spaces Direct (S2D) is Microsoft’s new kernel-mode software-defined-storage model exclusive to Server 2016. In the last incarnation of Storage Spaces on Server 2012R2, JBODs were required with SAS cables running to each participating node that could then host SMB namespaces. No longer! Server 2016 Datacenter Edition, local disks and Ethernet (10Gb + RDMA recommended) are all you need now. The setup is executed almost exclusively in PowerShell which can be scripted, of course. Microsoft has positioned their first true HCI stack targeting the smaller side of SMB with a 16 node maximum scale. The S2D architecture runs natively on a minimum of 2 nodes configured in a Failover Cluster with 2-way mirroring.
NVMe, SSD or HDDs installed in each host are contributed to a 2-tier shared storage architecture using clustered mirror or parity resiliency models. S2D supports hybrid or all-flash models with usable disk capacity calculated using only the capacity tier. SSD or NVMe can be used for caching and SSD or HDD can be used for capacity. Or a mix of all three can be used with NVMe used for cache, SSD and HDD providing capacity. Each disk tier is extensible and can be modified up or down at any time. Dynamic cache bindings ensure that the proper ratio of cache:capacity disks remain consistent for any configuration regardless of whether cache or capacity disks are added or removed. The same is true in the case of drive failure in which case S2D self heals to ensure a proper balance. Similar to VMware VSAN, the storage architecture changes a bit between hybrid or all-flash. In the S2D hybrid model, the cache tier is used for both writes and reads. When the all-flash model is in play, the cache tier is used only for writes. Cluster Shared Volumes are created within the S2D storage pool and shared across all nodes in the cluster. Consumed capacity in the cluster is determined by provisioned volume sizes, not actual storage usage within a given volume.

A new Switch Embedded Teaming (SET) model brings NIC teaming integration to Hyper-V in a way that provides easy pNIC service protection and vNIC scale out for distributed management architectures. By contrast, in 2012R2 the teaming mechanism exists at the Windows OS layer with a few load balancing modes included. For Hyper-V in 2016 SET is the model you want to use. Important to note that this should not be combined with any other NIC teaming option, you need to use one or the other. vNICs are created to connect VMs to the SET switch or used by the Management OS for clustering or other services. If you want to use different VLANs for specific services, a vNIC per VLAN will be required. At a minimum, you will want three vNICs, one for mgmt and two for storage IO. Things like CSV, cluster heartbeating and Live Migration can easily make use of the RDMA/ SMB vNICs.

image

NTFS is available but ReFS is the recommended file system for most implementations which currently doesn’t support deduplication. Storage capacity efficiency is directly related to the resiliency model you choose to implement for your volumes. Mirroring does as it suggests by creating 2 or 3 copies of data on discrete hosts. Parity, also known as Erasure Coding, is similar to a RAID model which uses less storage for resiliency but at the cost of disk performance. New to Server 2016 is a mixed parity mode that allows a volume to exist as part mirror and part parity. Writes would first go to the mirror portion then later be de-staged to the parity portion. A desired level of fault tolerance will affect the minimum number of nodes required per a given configuration, as outlined in the table below.

Resiliency Fault Tolerance Storage Efficiency Minimum # hosts
2-way mirror 1 50% 2
3-way mirror 2 33% 3
Dual parity 2 50-80% 4
Mixed 2 33-80% 4

Much more information on S2D resiliency and examples here. As a workload, RDS layers on top of S2D as it would with any other Failover Cluster configuration. Check out my previous series for a deeper dive into the native RDS architecture.

Lab Environment
For this exercise I’m running a 3-node cluster on Dell R630’s with the following specs per node:

  • Dual E5-2698v4
  • 256GB RAM
  • HBA330
  • 4 x 400GB SAS SSD
  • 5 x 1TB SAS HDD
  • Dual Mellanox ConnectX-3 NICs RDMA Over Converged Ethernet (ROCE)
  • Windows 2016 Datacenter (1607)

The basic high-level architecture of this deployment:

Part 1: Intro and Architecture (you are here)
Part 2: Prep & Configuration
Part 3: Performance & Troubleshooting

Resources

S2D in Server 2016
S2D Overview
Working with volumes in S2D
Cache in S2D

New PC Build for 2017

Credit: BitFenix

I can’t believe it’s time already, 2 years has flown by! I’ve managed to stick to a 2-year upgrade cadence for the last 8 years, performing meaningful upgrades at each interval. This year I debated skipping but I pressed forward as there are a few key technologies I want to enable: Pascal GPU, M.2 NVMe, DDR4 RAM and the Z270 chipset. 2 years is also a great time frame for reasonable cost reclamation on my used parts. The new Kaby Lake CPU upgrade doesn’t look to be a massive jump from the Haswell chip I ran for the past 2 years (4790K) and an even smaller step from Skylake. In case you want to check out my previous builds they can be found here and here.

I plan to reuse my BitFenix Phenom M Micro-ATX case which I absolutely love, my amazing Noctua NH-U12S CPU cooler + case fans and my Silverstone ST55F PSU, but those will be the only holdovers.


Motherboard

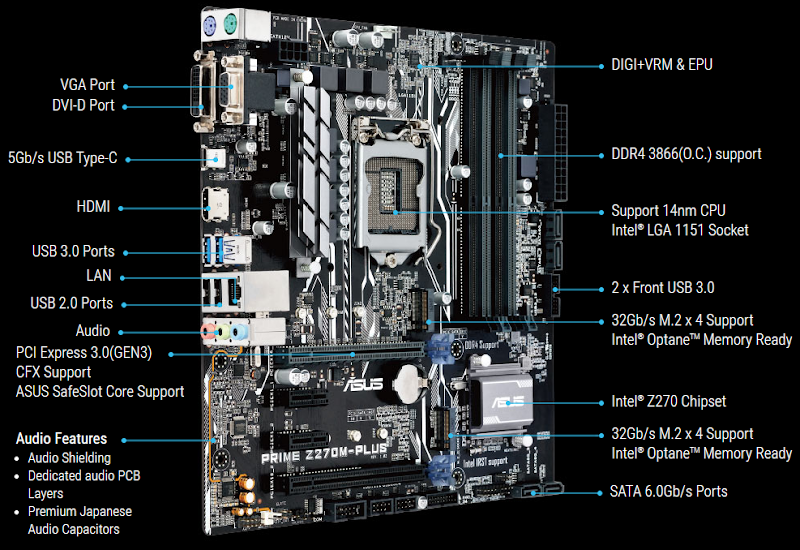
Micro-ATX is still the smallest form factor that works for me given what I want to achieve and I endeavor to go as small as possible.  The Asus ROG Strix Z270i came very close to pushing me into Mini-ITX. For this build I need 2 x M.2 slots and like the idea of having a 2nd PCIe slot should I want to do SLI at some point. 2 x DIMM slots is doable to run the 32GB RAM I need but again, no expansion while reusing my existing investment. So I stayed with mATX and went with the Asus Prime Z270M-Plus which will suit my needs without a lot of extra pizazz. There are a number of considerations in the Asus mobo lineup as well as in the Intel chipsets. The graphic below highlights the key features of my new board. Most notably, RAM clock support up to 3866MHz, a USB Type-C connector in the IO panel, dual x4 M.2 slots positioned optimally below the PCIe slots, Intel Gb NICs and SafeSlot Core which provides PCIe slot strength to hold those heavy GPUs.


Credit: Asus


Asus put together a great blog post that details all their current motherboard product lines and how they are differentiated. In short the Prime line is the all-around mainstream offer without a ton of extravagances, TUF is the military spec with drop resistance, Strix is geared at the gaming crowd with 5 levels (low to high) and supports higher RAM clocks, ROG is aimed at people who consider themselves enthusiasts with extra lighting support, overclocking options and the highest available RAM clocks. Having bought ROG boards in the past and not used a fraction of the extra stuff they come with, I took a serious feature evaluation on exactly what I need in a motherboard. Prime suits my needs just fine and the saved $ is welcomed.


Chipset

The 270 is the new chipset for the 7th gen Intel proc and comes in “Z” or “H” variations. Z for consumers includes features like overclocking while H is geared more for corporate builds with less features. New in the 200 series chipset is support for Intel’s Optane NVMe and dual m.2 slots with dedicated PCIe lanes. Both Skylake and Kaby Lake CPUs use the same 1151 socket and are interchangeable on either 100 or 200 series boards. Below is a PCH feature comparison of the 4 most relevant configurations at the moment. You notice the biggest difference between the 170 and 270 are more IO/PCIe lanes. Also on the 170 chipset, a M.2 device cost 2 x SATA ports since these share PCIe lanes (same on the Z97 boards), this tax has been removed on the 270.


Chipset

Intel Z270

Intel H270

Intel Z170

Intel H170

SKU Focus Segment

Consumer

Consumer / Corporate

Consumer

Consumer / Corporate

CPU Support

Kaby Lake-S / Skylake-S

Kaby Lake-S / Skylake-S

Kaby Lake-S / Skylake-S

Kaby Lake-S / Skylake-S

CPI PCI-e Configuration

1 x 16 or 2 x 8 or 1 x 8 + 2 x 4

1 x 16

1 x 16 or 2 x 8 or 1 x 8 + 2 x 4

1 x 16

Independent DisplayPort

3

3

3

3

Memory DIMMs

4

4

4

4

Overclocking

Yes

No

Yes

No

Intel SmartSound Technology

Yes

Yes

Yes

Yes

Intel Optane Technology

Yes

Yes

No

No

Intel Rapid Storage Technology

15

15

14

14

Intel Rapid Storage Technology From PCIe Storage Drive Support

Yes

Yes

Yes

Yes

RAID 0,1,5,10

Yes

Yes

Yes

Yes

Intel Smart Response Technology

Yes

Yes

Yes

Yes

I/O Port Flexibility

Yes

Yes

Yes

Yes

Maximum High Speed I/O Lanes

30

30

26

22

Total USB Ports (Max USB 3.0)

14 (10)

14 (8)

14 (10)

14 (8)

Max SATA 6 Gbps Ports

6

6

6

6

Max PCI-E 3.0 Lanes

24

20

20

16

Max Intel RST for PCIe Storage Ports (x2 M.2 or x4 M.2)

3

2

3

2


CPU

Intel is making it less difficult to choose a desktop CPU these days with far fewer overall options if you want a higher-end unlocked CPU under $500 and aren’t upgrading from a recent gen. If you want the best 8 core desktop CPU Intel has to offer and have no budget, look no further than the i7-6900K. If you’re upgrading from a 4th or earlier gen i7 the choice is simple: i7-7700K (14nm). If you have a Skylake CPU already (i7-6700K, also 14nm) there is no need to upgrade as any performance gain will be minimal. If you’re like me coming from Haswell (i7-4790K), the performance gain will be at best in the 10% range and may not be worth it, unless also like me, you want to upgrade to enable other specific features. It’s odd to put this in print, but for this build the CPU is actually the least exciting thing I’m adding here! It also appears that this trend will continue for the next few generations of Intel CPUs, so I might not be upgrading again in 2 years. Between the 6th and 7th generation CPUs mentioned above, the only improvements on the Kaby Lake are: +200MHz base clock (times 4 cores), +300MHz to Turbo,  increased DDR4 speeds, and new embedded graphics gen, same socket, same 91W TDP. There just isn’t much here to warrant an upgrade from 6th to 7th gen sadly.


Another alternative if you’re tired of the stale and uninspiring Intel lineup is the AMD Ryzen 7 coming in a few weeks. Early benchmarks show Ryzen beating the pants off of the highest end Intel chips. Promising to ship for a fraction of the cost ($329) and boasting 8 cores with a higher base clock but lower TDP, Ryzen should get serious consideration. This will be ultimately a good thing for Intel and push them to respond in kind upping their game to compete. Who knows, in 2 years I may be rebuilding with AMD.

Credit: AMD

CPU Cooler

Since the mounting of Intel CPUs hasn’t changed enough from the 4th gen CPUs, I was able to reuse my Noctua NH-U12S tower cooler which is designed to support many different mounting requirements. This all copper 6 heat piper cooler has 45MM fins so will not encroach on any  memory heat spreader, regardless of height. With the NF-F12 fan attached to the cooler, cold air is pushed across the fins, carrying hot air straight out the back of my case. This remains and excellent part and excellent choice for a SFF Kaby Lake PC build.

Credit: Noctua

Memory

Another reason I wanted to do this build was for the DDR4 upgrade as my Haswell build was DDR3. The memory market is a bit more complicated from the last time I looked at it, with most higher-end vendors playing the same marketing game. Most of the DIMMs available in this space are really 2133MHz DIMMs, but using XMP2 profiles enabled in the BIOS, the modules clock much higher. These modules are marketed using this higher frequency, which is not the default. This is the difference between the 1.2v SPD value of the module and the “tested” value enabled via higher voltage in XMP. What you pay for ultimately is this higher tested speed, a pretty heat spreader and a lifetime warranty.  After reading several articles comparing various DDR4 clock speeds across various benchmarks and applications, what is glaringly apparent is that the usefulness of faster memory fits into a very limited use case. In other words, almost no one will truly benefit by paying too much for high clocked RAM. My research showed that 3000MHz is about the sweet spot for DDR4 right now, anything faster is just more expensive with unlikely-to-achieve returns.

Now that said, I was initially sold on a 16GB x 2 kit from the Corsair Vengeance LPX line marketed at 3200MHz. I went with these because Corsair is a well regarded brand and they were priced like a lower clocked pair. I was unable to ever achieve the marketed speed of 3200MHz, the closet I got, stable, was 3100MHz. But to get there I had to overclock the CPU as well. With only XMP enabled on these modules, I was never able to even POST, so I sent them back. There were several other reviews stating the same problem, which I should have heeded. Read the negative reviews and don’t settle for sub-par quality!

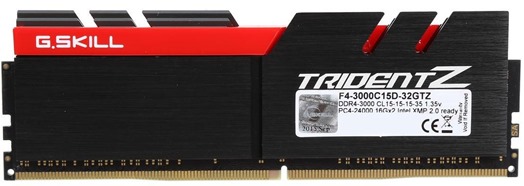
My second attempt was a 32GB 3000MHz TridentZ kit from G.Skill, F4-3000C15D-32GTZ. These modules are amazing, not only did the XMP profile take immediately as expected with no CPU OC required, they are quite possibly the most beautiful DIMMs I’ve ever laid eyes on. Pictures really don’t do them justice.

Credit: G.Skill


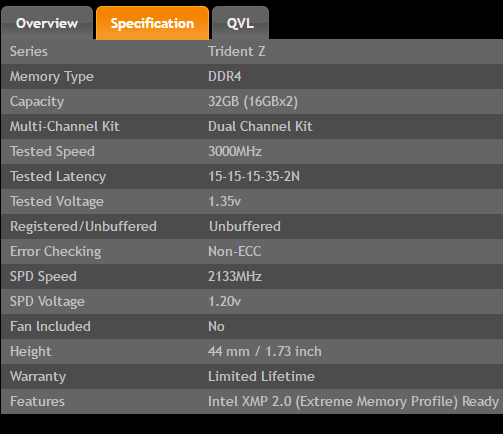
You’ll notice in the G.Skill spec table below the difference between the SPD and Tested values, these are sold with the tested speeds as you can see on the DIMM label above. Nevertheless, I REALLY like this memory!


XMP2 profile applied, RAM performing as tested, as expected.


One note on the capacity, how much RAM do you really need? Personally, I leave a ton of stuff open all the time on my PC. 50+ tabs in chrome, word docs, Visio diagrams, RDP sessions etc. I like not having to ever worry about not having enough memory, no matter the workload I need to run. Dishonored 2 itself can use upwards of 8GB all on its own! The other thing I like is not having to use a pagefile which saves wear and tear on my SSDs but also guarantees high performance for all applications. To pull this off, watch the committed value on the memory tab in Task Manager. If this grows anywhere near the amount of physical RAM you have, the pagefile should probably be left enabled. If not, you could disable the pagefile and ease the burden on your SSD.

Data

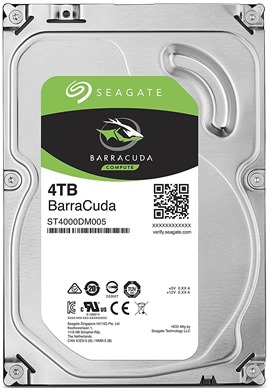
One the largest motivators for my upgrade this year was moving to Non-Volative Memory Express (NVMe), specifically for the really exciting modules in the new Samsung 960 line. I’ll continue my three-tier model for OS, apps and data, using NVMe for the first two and spinning media for the third. Eventually I’d like to replace the data tier with an SSD, when the time is right. For this build I have a 512GB Samsung 960 Pro for my C drive, a 500GB Samsung 960 Evo for the app drive and a 4TB Seagate BarraCuda 3.5” SATA disk for archive data. These new Samsung NVMe modules are outperforming anything else in this space right now with the following factory performance profiles.


Module Capacity Sequential Reads Sequential Writes
960 Pro 512GB 3500MB/s 2100MB/s
960 Evo 500GB 3200MB/s 1900MB/s


These optimistic factory numbers are several times faster than any SSD from any previous build. Crazy! As of this writing, the 512GB Pro module is $330 with the 500GB Evo at $250. Definitely a healthy cost differential for what you may argue is a near negligible performance delta. I wanted, what was perceived, as the fastest NVMe on the market so it seemed worth the price. Capacities on the Pro module go up to 2TB and 1TB on the Evo. The other big difference between these is the Pro modules come with a 5 year warranty vs 3 years on the Evo. These are x4 PCIe 3.0 modules using Samsung’s new famed Polaris controller and 48-layer V-NAND memory.


Credit: Samsung


For local archive data I’m running the 4TB Seagate BarraCuda which is 6Gb SATA and 3.5”. Not a lot to say about this guy, who is a dinosaur in the making.

Credit: Seagate


My basic data scheme goes like this: C: OS only, D: Apps, games and a copy of working data (Dropbox), X: maintains a copy of working data from D and anything else too large or unimportant enough to replicate. Important data is then replicated to a 3rd target: NAS.


Graphics

Upgrading my graphics capability was easily the most noticeable upgrade from my prior build. My previous MSI GTX970 was so solid, I went that way again with a MSI GTX1070 Gaming X 8G. I’m a huge fan of these cards. This one in particular comes with a back plate, 8GB GDDR5 memory @ 8108MHz, a tunable GPU clock and fans that only run when temps exceed 60C (which isn’t very often). The 1080 model gets you higher GPU and memory clocks with more CUDA cores but looking at the benchmarks it barely outperforms its lesser sibling the 1070. I haven’t yet been able to throw anything that this card couldn’t handle at ultra resolution settings, so far Dishonored2, Mafia3 and Dues Ex: Mankind Divided.
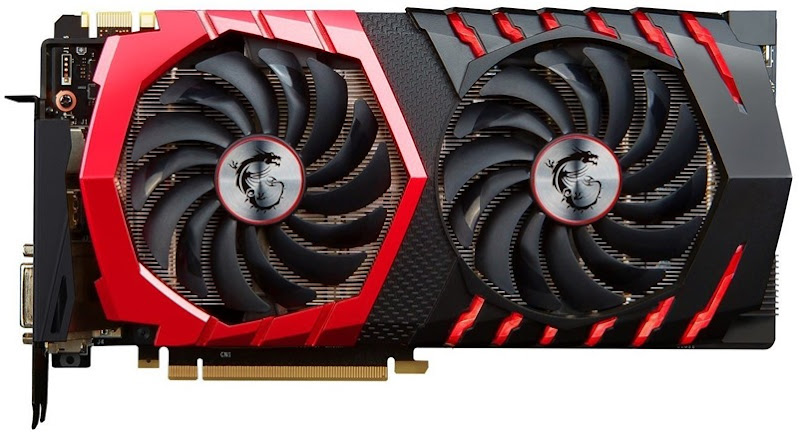
Credit: MSI

PSU

Reusing now for its third build in a row, my trusty Silverstone ST55F. Full modularity providing up to 600w max output with a 140mm footprint at 80Plus Gold efficiency… Hard to beat this one, unless your case can’t accept the depth. One step above is the newer ST55F with the platinum efficiency rating. The PP05 short cable kit worked well again and kept cable clutter to a minimum, although I don’t require many cables anymore. And now with the NVMe’s I used a full cable less no longer needing to power 2 extra SATA devices. As always, make sure to check JonnyGuru.com first for thorough and detailed PSU reviews, the ST55F scores very high there.

Credit: Silverstone


Fans

High quality SSO-bearing driven cooling with a low decibel rating and zero vibration is worth the small upcharge. Noctua makes the best fans on the market, so outfitted the entire case. Dual NF-F12 PWM 120mm at the top for downward intake and 1 x NF-A14 140mm fan at the rear for exhaust, in addition to the 120mm NF-F12 on the CPU cooler. I can’t recommend these highly enough.
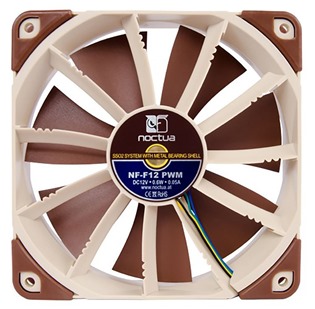
Credit: Noctua

Case and Complete Build

Once again I built into my BitFenix Phenom M which remains my favorite as easily the best case I’ve ever built with. If you go this route I highly recommend you flip the side panels putting the panel with the buttons and USB ports on the left side of the case instead of the default right side. Otherwise, any time you need to open the case you will have to contend with cords and possibly unplugging cables from a power switch or USB header. 
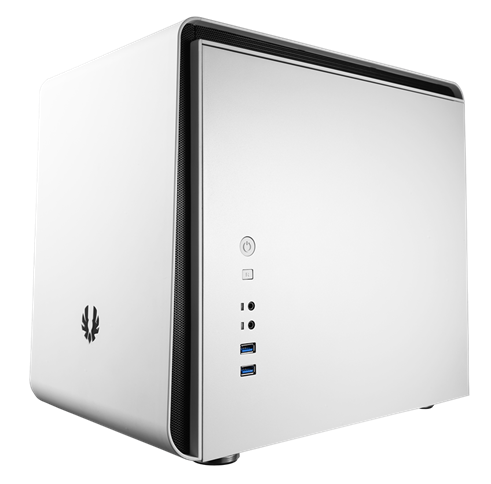
 

Credit: BitFenix


The Phenom is a mix of steel and soft plastic with the same basic air flow design as the SG09: top down cooling, rear and optional bottom exhaust. This goes against the natural order of things (heat rising) but works very well with 2 x 120mm NF-F12 fans blowing cool air down into the case, directly into the GPU, down into the CPU cooler’s fan blowing across the tower fins and 140mm at the back to exhaust. The GPU breaths cool air, blows it across the PCB and out the rear slot. The rear fan can be either 120mm or 140mm, I opted for the later which is audible at times briefly under load but provides extremely effective cooling. Otherwise this build is silent! The black removable dust filter along the top of the case is the only filtered air input aside from the mesh in the front cover used by the solely PSU, which exhausts downward below the case. The case supports a 120mm radiator, such as the Corsair H80i, if desired. The base section can support dual 120mm fans, a single 200mm fan, or 2 x 3.5” HDDs. The case also comes with a removable heat shield underneath to prevent exhaust heat from the PSU getting sucked back into the case. Lots of different configurations are possible with this case which is fantastic!

The image below shows my completed build and illustrates the airflow scheme per my design selections.  Ultimately this case works extremely well and keeps all components well cooled. There aren’t a lot of nooks to tuck cables into in this case so bundling is about as good as it gets which is complicated when using shorter cables. The key is to not block any airflow with the bundle.


CPU Performance

The tools I used to benchmark CPU are PassMark PerformanceTest 9 and Cinebench. The CPU Mark results with the 2 reference parts tells the tale, there is only a very small incremental gain over my previous 4790K. The gain is even smaller from the reference 6700K Skylake part, reinforcing the fact that if you own Skylake now, there is really no point at all upgrading to Kaby Lake. My results for all components ranked within the 99th percentile according to PassMark.


Similar story on Cinebench but as is the case with all the benchmarks, there’s a ton of variance and a wide spread in the scores.


Memory Performance

For the Memory Mark I included a few other high-end PC builds with varying memory speeds. Not sure how useful this bench is honestly due to that top result on slower DDR3, shown below. Generally not a lot of variance here further suggesting that paying for higher RAM clocks is probably not worth it.


Graphics Performance

At the time I bought my new MSI GTX 1070 Gaming X board, the benchmarks showed this card barely below the top dog 1080, but for a significant cash savings. Coming from the 970, the 1070 is improved in every way with more memory, more cores, higher clocks and higher supported resolutions (4K). There was nothing my prior 970 couldn’t handle, as long as I had my games properly optimized, which meant a setting quality, at best, to “high”. With the 1070 I can run very intensive titles like Dishonored 2 at Ultra settings with no trouble at all.


+3500 points in the 3D graphics mark test:


Old vs new on the Unigine Heaven bench, pretty significant difference even running the 1070 a step higher at Ultra:


960 Pro vs 960 Evo

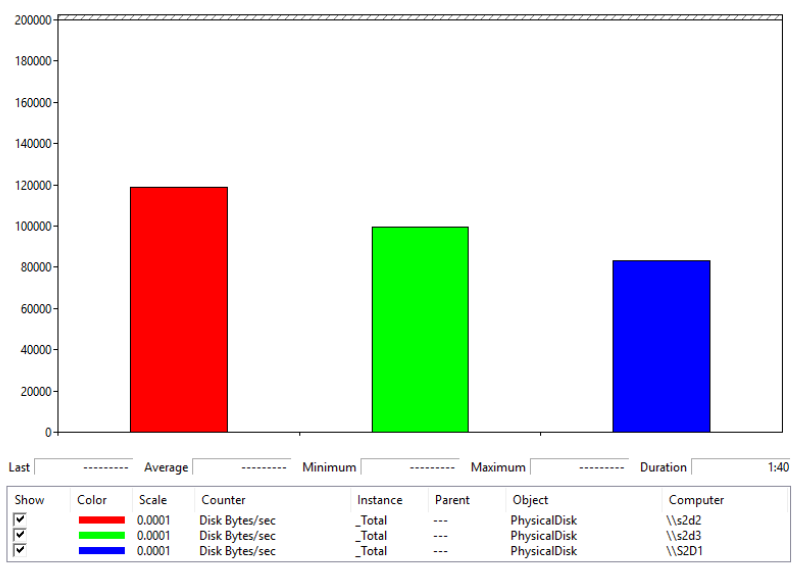
Ok prepared to be amazed, here are the 960’s in action. This test consists of running a simple Crystal Disk Mark bench while monitoring IOPS with Perfmon. The 960 Pro generates nearly 200,000 read IOPS while clocking a staggering 3255 MB/s, which as amazing as that is, is actually much lower than what this part should be capable of!


Writes clock in around 140,000 IOPS with 1870MB/s on the 32 queues sequential test.


The highest numbers I observed in these tests were 3422MB/s reads and 1990MB/s writes. Impressive, but still below the advertised 3500/ 2100MB/s and the performance of this module is not nearly as consistent as it should be.The 960 Evo is no slouch either and actually outperforms the Pro in these tests!! This definitely should not be the case.


Running the same bench, the 960 Evo generated 203,000 IOPS while pushing 3335 MB/s. This is higher than the Pro module in both areas.


Reads are also impressive here and while the Evo doesn’t beat the Pro in MB/s, it does clock in 13,000 IOPS higher.


Running the benchmark within Samsung Magician draws an even starker picture. The Evo absolutely kills the Pro in read performance but the Pro wins the write bench by a small margin. These results should not be.


In light of this, the Pro module is going back, I’ll update this post with new numbers once I receive my replacement part. If the replacement doesn’t perform, it too will be going back to be replaced by another Evo module instead. As is stands, the Evo’s performance is very predictable, uncomfortably close to the Pro and for $65 less it may be the better buy, if you don’t mind a shorter 3 year warranty.


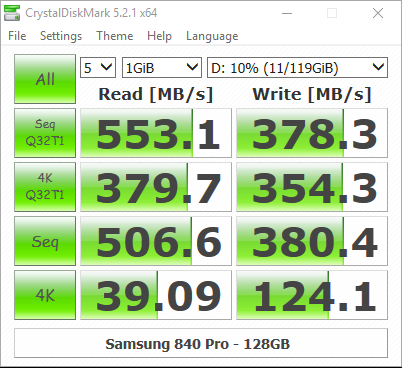
Just for comparison, here is the DiskMark for my older Samsung 840 Pro which is a solidly performing SSD:


Temps & Power Consumption

Even with my case’s upside-down airflow design, it does a good job keeping things cool. This is also in no small part due to the incredible Noctua fans which are literally the best you can buy and well worth it. I run my PC using the default Balanced power plan which allows the CPU to throttle down during idle or low activity periods. At idle with fans running at low speeds and the core voltage at .7v, the CPU chirps along at a cozy 38C with the fans barely spinning.


Under benchmark load with the CPU pegged at 100%, temps shift between low 50s to low 60’s with fans shifting their RPMs upward in kind. I touched 66 a couple of times but couldn’t capture the screenshot. 63 degrees under load I’d say is very good for this CPU! Once the Arctic Silver 5 thermal compound breaks in completely this should get a touch better.


During the PassMark bench I recorded the temps, voltage and frequency as shown below. Here you can see the full affect of the Kaby Lake stock Turbo in play with the CPU running its max clock of 4.5GHz. 55 degrees recorded with the fans at less than 50%. You can also see the XMP2 profile in affect with the RAM clock at 3000MHz.


I recorded power draw at idle and under load with a heavy graphics bench, where the PC will draw its highest wattage with the GPU thirstily slurping juice. At its lowest observed reading with absolutely nothing happening, I recorded 41W at the wall. Very efficient.


Under the heavy graphics bench, the highest reading I observed was 244w at the wall. As it stands, given my components, their power draw and my hungriest graphical workload, my 550W PSU is more than sufficient for this build.


Build Summary

All in all this is a pretty exciting year to build a high-end PC with loads of improvements available in graphics and disk.


Motherboard Asus Z270M-Plus $150
CPU Intel Core i7-7700K $379
CPU Cooler Noctua NH-U12S (reuse)
Memory G.Skill TridentZ $200
OS NVME
Apps NVMe
Data HDD
Samsung 960 Pro
Samsung 960 Evo
Seagate Baracuda
$330
$250
$130
Graphics MSI GTX 1070 Gaming X $399
PSU Silverstone SST-ST55F-G (reuse)
Fans Noctua NF-F12 PWM
NF-A14 PWM
(reuse)
Case BitFenix Phenom M (reuse)
OS Window10 Pro  
Monitors 2 x Dell U2415b (reuse)
Mouse & Keyboard Corsair M65/ K70 (reuse)
                       Total invested   $1838

Dell EMC ScaleIO – Scale and Performance for Citrix XenServer

You’ll be hearing a lot more about Dell EMC ScaleIO in the coming months and years. ScaleIo is a Software Defined Storage solution from Dell EMC that boasts massive flexibility, scalability and performance potential. It can run on nearly any hardware configuration from any vendor, all-flash or spinning disk, as well as supports XenServer, Linux and VMware vSphere. Like most other SDS solutions, ScaleIO requires a minimum of three nodes to build a cluster but unlike most others, ScaleIO can scale to over 1000 nodes in a single contiguous cluster. ScaleIO uses a parallel IO technology that makes active use of all disks in the cluster at all times to process IO. This performance potential increases as you scale and add nodes with additional disks to the cluster. This translates to every VM within the cluster being able to leverage the entire available performance profile of every disk within the cluster. Limits can be imposed, of course, to prevent any single consumer from draining all available IO but the greater potential is immense.


Key Features

  • Tiering – Unlike most SDS offers available, ScaleIO requires no tiering. For an all-flash configuration, every SSD in every node is completely usable. DAS Cache is required on hybrid models for write-back caching. It should also be noted that for hybrid configurations, each disk type must be assigned to separate volumes. There is no mechanism to move data from SSD to HDD automatically.
  • Scalability – 3 nodes are required to get started and the cluster can scale to over 1000 nodes.
  • Flexibility – Software solution that supports all hardware, all major hypervisors. Able to be deployed hyper-converged or storage only.
  • Data protection – two-copy mirror mesh architecture eliminates single points of failure.
  • Enterprise features – QOS, thin provisioning, snapshotting.
  • Performance – Parallel IO architecture eliminates disk bottlenecks by using every disk available in the cluster 100% of the time. The bigger you scale, the more disks you have contributing capacity and parallel IO. This is the ScaleIO killer feature.


ScaleIO Architecture

ScaleIO can be configured in an all-combined Hyper-converged Infrastructure (HCI) model or in a traditional distributed storage model. The HCI variant installs all component roles on every node in the cluster with any being able to host VMs. The distributed storage model installs the server pieces on dedicated infrastructure utilized for presenting storage only. The client consumer pieces are then installed on separate compute-only infrastructure. This model offers the ability to scale storage and compute completely separately if desired. For this post I’ll be focusing on the the HCI model using Citrix XenServer. XenServer is a free to use open source hypervisor with a paid support option. It doesn’t get much easier than this with XenServer running on each node and XenCenter running on the admin device of your choosing. There is no additional management infrastructure required! ScaleIO is licensed via a simple $/TB model but too can be used in trial mode.


The following are the primary components that comprise the ScaleIO architecture:

  • ScaleIO Data Client (SDC) – Block device driver that runs on the same server instance as the consuming application, in this case VMs. In the HCI model all nodes will run the SDC.
  • ScaleIO Data Server (SDS) – Not to be confused with the general industry term SDS, “SDS” in the ScaleIO context is a server role installed on nodes that contribute storage to the cluster. The SDS performs IOs at the request of the SDCs. In the HCI model all nodes will run the SDS role.
  • Metadata Manager (MDM) – Very important role! The MDM manages the device mappings, volumes, snapshots, storage capacity, errors and failures. MDM also monitors the state of the storage system and initiates rebalances or rebuilds as required.
    • The MDM communicates asynchronously with the SDC and SDS services via a separate data path so to not affect their performance.
    • ScaleIO requires at least 3 instances of the MDM: Master, Slave and Tie-Breaker.
    • A maximum of 5 MDM roles can be installed within a single cluster: 3 x MDMs + 2 x tie-breakers.
    • Only one MDM Master is active at any time within a cluster. The other roles are passive unless a failure occurs.
  • ScaleIO Gateway – This role includes Installation Manager for initial setup as well as the REST Gateway and SNMP trap sender. The Gateway can be installed on the ScaleIO cluster nodes or an external management node.
    • If the gateway is installed on a Linux server, it can only be used to deploy ScaleIO to Linux hosts.
    • If the gateway is installed on a Windows server, it can be used to deploy ScaleIO to Linux or Windows hosts.
    • XenServer, based on CentOS, fully qualifies as a “Linux host”.


Once the ScaleIO cluster is configured, all disks on each host are assigned to the SDS local to that host. Finally volumes are created and mounted as consumable to applications within the cluster.


The diagram below illustrates the relationship of the SDC and SDS roles in the HCI configuration:


My Lab Environment:

  • 3 x Dell PowerEdge R630
    • Dual Intel E5-2698v4
    • 512GB RAM
    • 480GB Boot SSD
    • 4 x 400GB SSDs
    • 5 x 1TB (7.2K RPM)
    • 2 x 10Gb NICs
  • XenServer 6.5
  • ScaleIO 2.0
  • XenDesktop 7.11
  • I also used a separate Windows server on an old R610 for my ScaleIO Gateway/ Installation Manager


Here is the high-level architecture of my deployment. Note that there is a single compute volume which is mounted locally on each host via the XenServer Pool, so depicted below as logical on each:


Prep

As of this writing, XenServer 7.0 is shipping but 6.5 is the currently supported version by ScaleIO. The deployment steps for 7.0 should be very similar once officially supported. First install XenServer on each node, install XenCenter on your PC or management server, create a new pool, add all nodes to XenCenter, create a pool and fully patch each node with the XenCenter integrated utility. If the disks installed in your nodes have any prior formatting this needs to be removed in the PERC BIOS or via the fdisk utility within XenServer.

Now would be a good time to increase the memory available to Dom0 to the maximum 4GB, especially if you plan to run more than 50 VMs per node. From an SSH session or local command shell, execute:

/opt/xensource/libexec/xen-cmdline --set-xen dom0_mem=4096M,max:4096M


Install the packages required for ScaleIO on each node: numactl and libaio. OpenSSL needs to be updated to 1.0.1 using the XenCenter update utility via Hotfix XS65ESP1022.

Libaio should already be present but before numactl can be added, the repositories will need to be edited. Open the base repository configuration file:

vi /etc/yum.repos.d/CentOS-Base.repo

Enable the Base and released updates repositories changing “enabled=0” to “enabled=1”. Save the file, :wq


Next install numactl, libaio should report as already installed, nothing to do. Repeat this on each node.

yum install numactl


ScaleIO Installation

Download all the required ScaleIO files: Gateway for Windows or Linux, as well as all the installation packages for ScaleIO (SDC, SDS, MDM, xcache, and lia). Install the ScaleIO Gateway files, either for Windows to do an external remote deployment, or for Linux to install the gateway on one of the XenServer nodes. For this installation I used an external Windows server to conduct my deployment. The ScaleIO Gateway installation for Windows has two prerequisites which must be installed first:

  • Java JRE
  • Microsoft Visual C++ 2010 x64 Redist

Next run the gateway MSI which will create a local web instance used for the remainder of the setup process. Once complete, in the local browser connect to https://localhost/login.jsp, and login using admin plus the password you specified during the Gateway setup. 


Once logged in, browse to and upload the XenServer installation packages to the Installation Manager (installed with the Gateway).


Here you can see that I have the ScaleIO installation packages for Xen 6.5 specifically.


Once ready to install, you will be presented with options to either upload an installation CSV file, easier for large deployments, or if just getting started you can select the installation wizard for 3 or 5-node clusters. I will be selecting the wizard for 3-nodes.


Specify the passwords for MDM and LIA, accept the EULA, then enter IP addresses and passwords for the mandatory three MDM instances at the bottom. The IP addresses at the bottom should be those of your physical XenServer nodes. Once all information is properly entered, the Start Installation button will become clickable. If you did not install the 1.0.1 OpenSSL patch earlier, this step will FAIL.


Several phases will follow (query, upload, install, configure) which should be initiated and monitored from the Monitor tab. You will be prompted to start the following phase assuming there were no failures during the current phase. Once all steps complete successfully, the operation will report as successful and can be marked as complete.


ScaleIO Configuration

Next install then open the ScaleIO GUI on your mgmt server or workstation and connect to master MDM node configured previously. The rest of the configuration steps will be carried out here.


First thing, from the Backend tab, rename your default system and Protection Domain names to something of your choosing. Then create a new storage pool or rename the default pool.


I’m naming my pools based on the disk media, flash and spinning. Create the pool within the Protection Domain, give it a name and select the caching options as appropriate.


Before we can build volumes we need to assign each disk to each SDS instance running on each node. First identify the disk device names on each host via SSH or local command shell by running:

fdisk -l


Each device will be listed as /dev/sdx. Right-click the first SDS on the first node and select Add Device. In the dialog that follows, add each local disk on this node, assign it to the appropriate pool and name it something meaningfully unique. If your disk add operation fails here, you probably have previous formatting on your disks which needs to be removed first using fdisk or the PERC BIOS! You can add both SSD and HDD devices as part of this operation.


Once this has been successfully completed for each node, you will see all disks assigned to each SDS in the GUI along with the total capacity contributed by each. You’ll notice that the circular disk icons next to each line are empty, because so are the disks at the moment.


Now keep in mind that ScaleIO is a mirror mesh architecture, so only half of that 4.4TB capacity is usable. From the Frontend tab, right-click the Storage Pool and create a new volume with this in mind. I’m using thick provisioning here for the sake of simplicity.


Once the volume is created, map it to each SDC which will make it available as a new disk device on each node. Right-click the volume you just created and select Map Volumes. Select all hosts then map volumes.


If you run fdisk -l  now, you will see a new device called /dev/scinia. The final step required before we can use our new storage is mounting this new device on each host which only needs to be done once if your hosts are configured in a Pool. By default the XenServer LVM is filtering so does not see our ScaleIO devices called “scini”. Edit the lvm configuration file and add this device type as highlighted below. Pay particular care to the text formatting here or LVM will continue to ignore your new volumes.

vi /etc/lvm/lvm.conf


Next confirm that LVM can see the new ScaleIO device on each node, run:

lvmdiskscan


Now it’s time to create the XenServer Storage Repository (SR). Identify the UUIDs of the ScaleIO volumes presented to a host and identify the UUID of the host itself, just pick a host from the pool to work with. You will need the output of both of these commands when we create the SR.

ls -l /dev/disk/by-id | scini

xe host-list


This next part is critical! Because ScaleIO presents storage as a block device, specifically as an LVM, all thin provisioning support will be absent. This means that all VMs deployed in this environment will be full thick clones only. You can thin provision on the ScaleIO backend but all blocks must be allocated to your provisioned VMs. This may or may not work for your scenario but for those of you paying attention, this knowledge is your reward. 🙂 

Another very important consideration is that you need to change the “name-label” value for every SR you create. XenServer will allow you to create duplicate entries leaving you to guess which is which later! Change the portions in red below to match your environment.

xe sr-create content-type="ScaleIO" host-uuid=8ce515b8-bd42-4cac-9f76-b6456501ad12 type=LVM device-config:device=/dev/disk/by-id/scsi-emc-vol-6f560f045964776a-d35d155b00000000 shared=true name-label="SIO_FlashVol"


This command will give no response if successful, only an error if it wasn’t. Verify that the volumes are now present by looking at the Pool storage tab in XenCenter. Creating this SR on one host will enable access to all within the pool.


Now the disk resources are usable and we can confirm on the ScaleIO side of things by going back to the dashboard in the ScaleIO GUI. Here we can see the total amount of raw storage in this cluster, 15.3TB, the spare amount is listed in blue (4.1TB), the thin yellow band is the volume capacity with the thicker green band behind it showing the protected capacity. Because I’m using thick volumes here, I only have 1.4TB unused. The rest of the information displayed here should be self-explanatory.


ScaleIO & XenDesktop

Since we’re talking about Citrix here, I would be remiss if I didn’t mention how XenDesktop works in a ScaleIO environment. The setup is fairly straight-forward and since we’re using XenServer as the hypervisor, there is no middle management layer like vCenter or SCVMM. XenDesktop talks directly to XenServer for provisioning, which is awesome.


If running a hybrid configuration, you can separate OS and Temporary files from PvDs, if desired. Here I’ve placed my PvD’s on my less expensive spinning volume. It’s important to note that Intellicache will not work with this architecture!


Select the VM network which should be a bond of at least 2 NICs that you created within your XenServer Pool. If you haven’t done this yet now would be a good time.


Finish the setup process then build a machine catalog using a gold master VM that you configured and shut down previously. I’ve configured this catalog for 100 VMs with 2GB RAM and 10GB disk cache. The gold master VM has a disk size of 24GB. Here you can see my catalog being built and VMs are being created on each host in my pool.


This is where things get a bit…sticky. Because ScaleIO is a block device, XenServer does not support the use of thin provisioning, as mentioned earlier. What this means is that the disk saving benefits of non-persistent VDI will be absent as well. Each disk image, PvD and temporary storage allocated to each VM in your catalog will consume the full allotment of its assignment.  This may or may not be a deal breaker for you. The only way to get thin provisioning within XenServer & XenDesktop is by using shared storage presented as NFS or volumes presented as EXT3, which in this mix of ingredients, applies to local disk only. In short, if you choose to deploy VDI on ScaleIO using XenServer, you will have to use thick clones for all VMs.


Performance

Lastly, a quick note on performance, which I tested using the Diskspd utility from Microsoft. You can get very granular with diskspd to model your workload, if you know the characteristics. I ran the following command to model 4K blocks weighted at 70% random writes using 4 threads, cache enabled, with latency captured.

Diskspd.exe -b4k -d60 -L -o2 -t4 -r -w70 -c500M c:\io.dat


Here’s the output of that command real time from the ScaleIO viewpoint to illustrate performance against the SSD tier. Keep in mind this is all being generated from a single VM, all disks in the entire cluster are active. You might notice the capacity layout is different in the screenshot below, I reconfigured my protection domain to use thin provisioning vs thick when I ran this test.


Here is a look at the ScaleIO management component resource consumption during a diskspd test against the spinning tier generated from a single VM. Clearly the SDS role is the busiest and this will be the case across all nodes in the cluster. The SDC doesn’t generate enough load to make it into Top plus it changes its PID every second.


Closing

There are a lot of awesome HCI options in the market right now, many from Dell EMC. The questions you should be asking are: Does the HCI solution support the hypervisor I want to run? Does the HCI solution provide flexibility of hardware I want to run? And, is the HCI solution cost effective? ScaleIO might be perfect for your use case or maybe one of our solutions based on Nutanix or VSAN might be better suited. ScaleIO and XenServer can provide a massively scalable, massively flexible solution at a massively competitive price point. Keep in mind the rules on usable disk and thin provisioning when you go through your sizing exercise.


Resources

XenServer Hotfixes

Configure Dom0 memory

ScaleIO Installation Guide

ScaleIO User Guide